April 2020 Is A Buyer’s Market
A buyer’s market is when there are more than 6 months of inventory based on closed sales. A seller’s market is when there is less than 3 months of inventory based on closed sales. A neutral market is when there is 3 – 6 months of inventory based on closed sales.
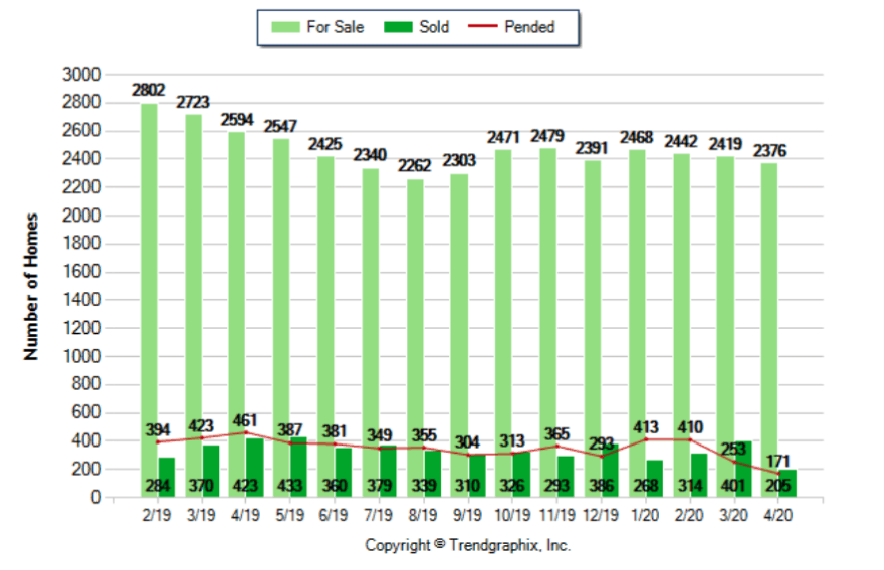
Home sales in April 2020 was 205. Sold homes were down 48.9% when compared to March 2020 and down 51.5% when compared to April 2019.
The current inventory of homes for sale in April 2020 was 2,376. The number of homes listed for sale was down 1.8% when compared to March 2020 and down 8.4% when compared to April 2019.
Homes for sale under contract in April 2020 was 171. The number of pended sales was down 32.4% when compared to March 2020 and down 62.9% when compared to April 2019.
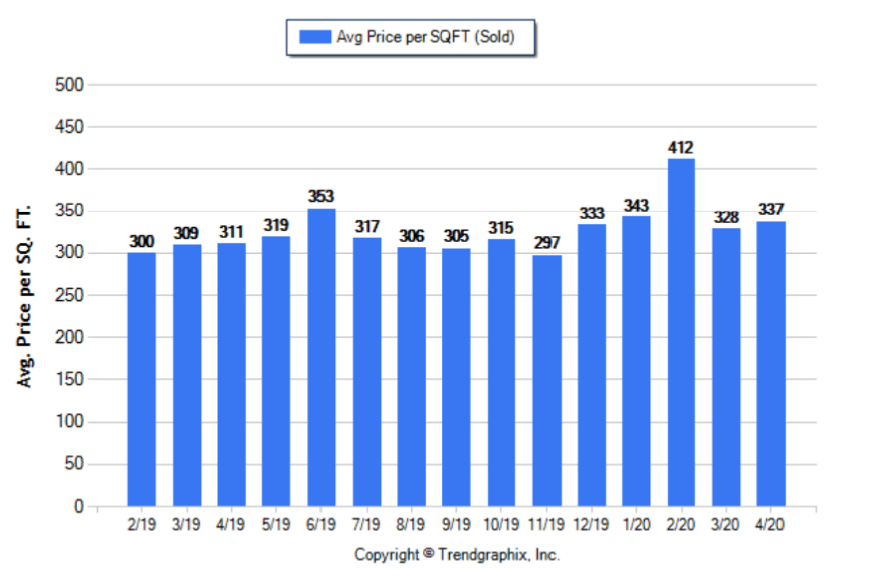
The Average Sold Price per Square Foot is Neutral*
The April 2020 average sold price per square foot was $307. The the number was up 2.7% when compared to March 2020 and the number was up 8.4% when compared to April 2019.
The Average Sold Price per Square Footage is a great indicator for the direction of property values. Since Median Sold Price and Average Sold Price can be impacted by the “mix” of high or low end properties in the market, the Average Sold Price per Square Footage is a more normalized indicator on the direction of property values.
* Based on 6 month trend – Appreciating/Depreciating/Neutral
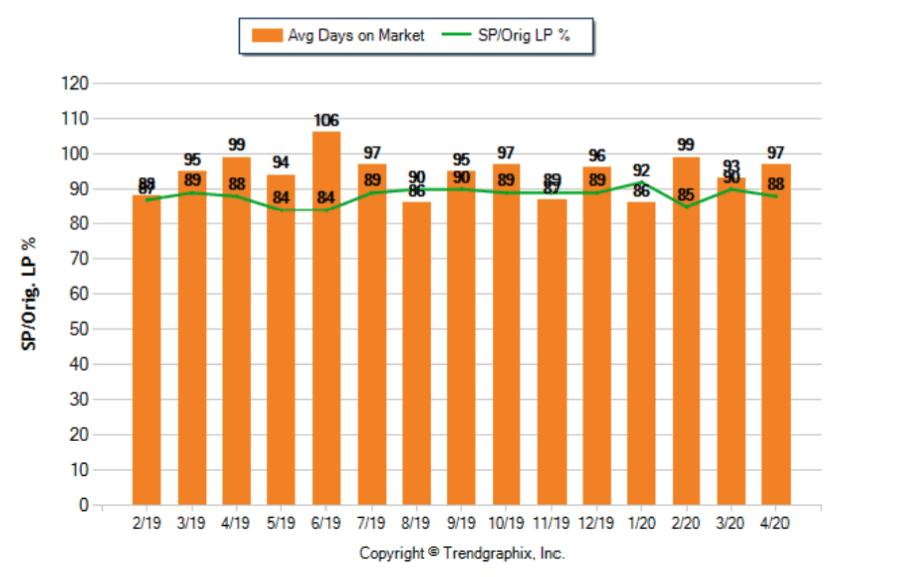
The Days on Market Trend Remains Steady*
The Days On Market (DOM) for April 2020 was 97. That number was up 4.3% when compared to March 2020 and down 2.2% when compared to April 2019.
The average DOM shows how many days the average property is on the market before it sells. An upward trend in DOM trends to indicate a move towards more of a Buyer’s market, a downward trend indicates a move towards more of a Seller’s market.
The Sold/Original List Price Ratio Remains Steady**
Sold Price vs. Original List Price for April 2020 was 88%. When compared to March 2020 that number was down 2.2% and when compared to April 2019 that number was the same.
The Sold Price vs. Original List Price reveals the average amount that sellers are agreeing to come down from their original list price. The lower the ratio is below 100% the more of a Buyer’s market exists, a ratio at or above 100% indicates more of a Seller’s market.
* Based on 6 month trend – Upward/Downward/Neutral
** Based on 6 month trend – Rising/Falling/Remains Steady
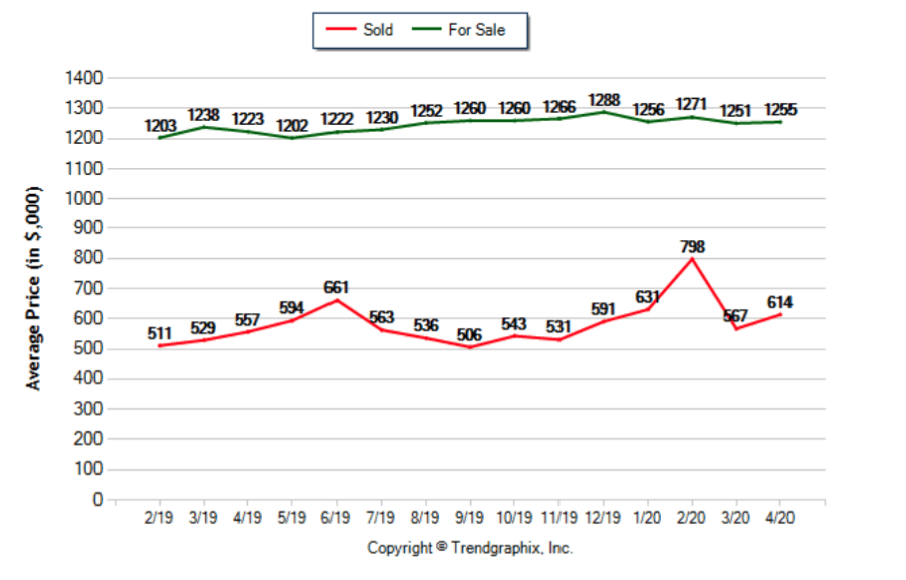
The Average For Sale Price is Neutral*
The Average For Sale Price in April 2020 was $1,255,000. When compared to March 2020 that number was up .3% and when compared to April 2019 that number was up 2.6%.
The Average Sold Price is Neutral*
The Average Sold Price in April 2020 was $614,000. When compared to March 2020 that number was up 8.3% and when compared to April 2019 that number was up 10.2%.
* Based on 6 month trend – Appreciating/Depreciating/Neutral
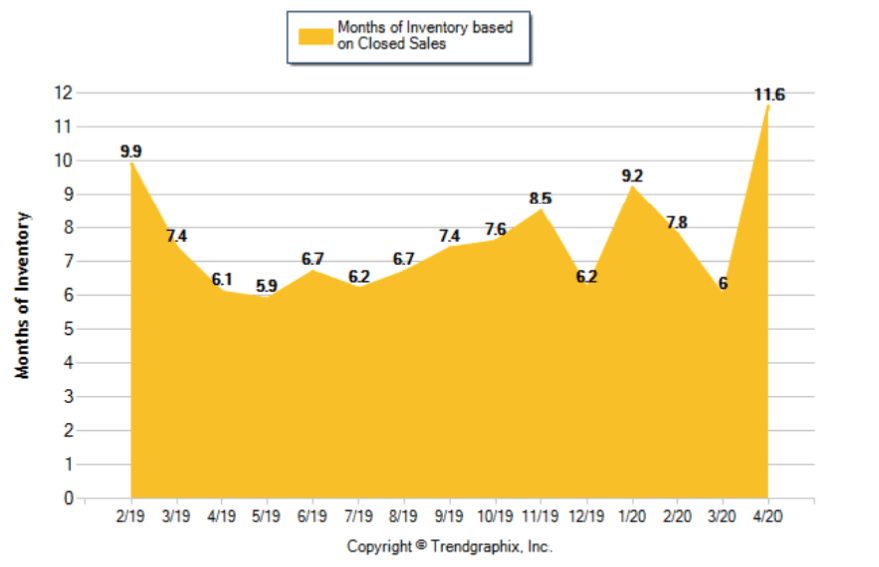
Months of Inventory Based on Closed Sales
The April 2020 months of inventory based on closed sales was 11.6. That number was up 92.8% when compared to March 2020 and up 89.7% when compared to April 2019. A comparatively lower Months of Inventory is more beneficial for sellers while a higher months of inventory is better for buyers. Therefore April 2020 was a buyer’s market.
All reports are published May 2020, based on data available at the end of April 2020. This representation is based in whole or in part on data supplied by the Realtor Association of Miami, the Greater Fort Lauderdale Realtors, or the Southeast Florida Multiple Listing Service (MLS). Neither the Board nor its MLS guarantees or is in any way responsible for its accuracy. Data maintained by the Board or its MLS may not reflect all real estate activity in the market.


