 The latest Fort Lauderdale housing market data reinforces a shift from a buyer’s market to that of a seller’s market. Popular indicators include the number of homes listed for sale and the amount of days a home was on the market before it sold, both of which continued to decline when compared to the same period last year.
The good news for home sellers spilled over to homeowners as well. Nationwide, bank repossessions fell 11% from December 2012 and were almost 30% lower than figures reported in February 2012, according to foreclosure listing firm RealtyTrac Inc. That is the lowest level since September 2007.
Across the country about 45,000 homes were foreclosed on in February 2013, which is less than half of the number of bank repossessions during the peak in March 2010. While the foreclosure rate across the country today is considered by RealtyTrac to be more than double of what it considers healthy, the marked improvement is yet another sign that the worst of the housing crisis is behind us.
More good news came from data firm CoreLogic, which reported that in the first nine months of 2012, 1.4 million homeowners moved from being underwater – owing more than their home was worth – into positive equity territory.
With the supply of homes for sale not meeting demand, we now have a seller’s market in many real estate hot spots, like Fort Lauderdale. In this popular destination for vacation and year-round living, bank-owned homes that are usually sold at a significant discount are receiving multiple bid offers. It is not unusual for these homes to be sold for more than the asking price.
Greater Fort Lauderdale Housing Market Trends, Comparing February 2012 with February 2013:
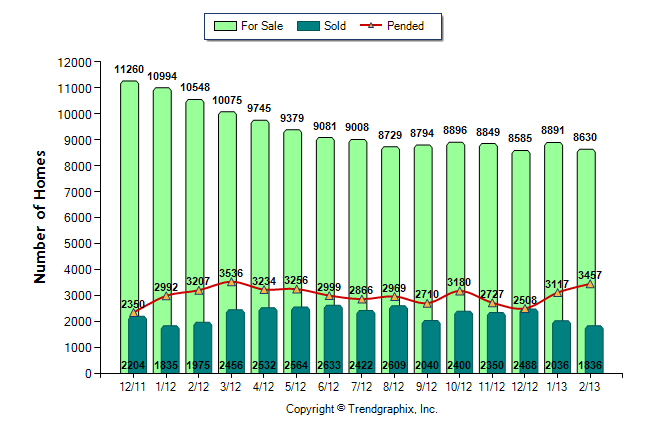
- The number of Greater Fort Lauderdale / Broward County homes listed for sale decreased 18.2% (10,548 vs. 8,630).
- The number of Greater Fort Lauderdale / Broward County homes sold decreased 7% (1,975 vs. 1,836).
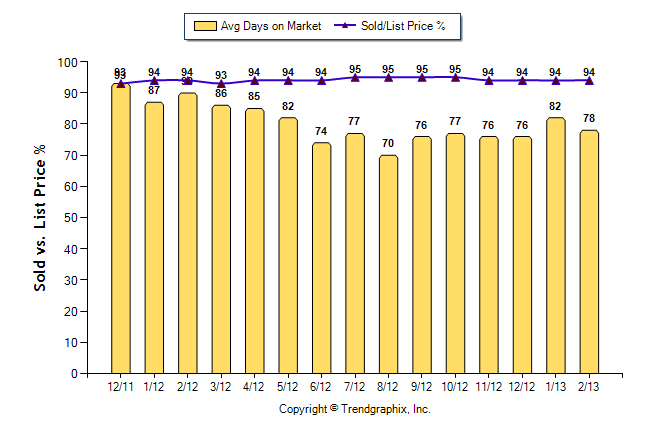
- The average amount of days a Greater Fort Lauderdale / Broward County home was listed for sale decreased 13.3% (90 vs. 78).
- The final sales price of a Greater Fort Lauderdale / Broward County home averaged 94% of the original listed price.
If you like charts and numbers, here they are! You can also view residential real estate data broken down by various areas in Greater Fort Lauderdale / Broward County by visiting the Greater Fort Lauderdale Real Estate News page.
Number of Houses in Greater Fort Lauderdale / Broward County For Sale vs. Sold vs. Pended (December 2011 – February 2012):
Average Days A Greater Fort Lauderdale / Broward County Home Was Listed For Sale & Sales Price vs. Original List Price (December 2011 – February 2012):